For our international customers, please be advised that orders cannot be placed through our website by customers in countries with International Distributor representation.
Introduction to Enzymes
Enzyme Concentration
In order to study the effect of increasing the enzyme concentration upon the reaction rate, the substrate must be present in an excess amount; i.e., the reaction must be independent of the substrate concentration. Any change in the amount of product formed over a specified period of time will be dependent upon the level of enzyme present. Graphically this can be represented as:
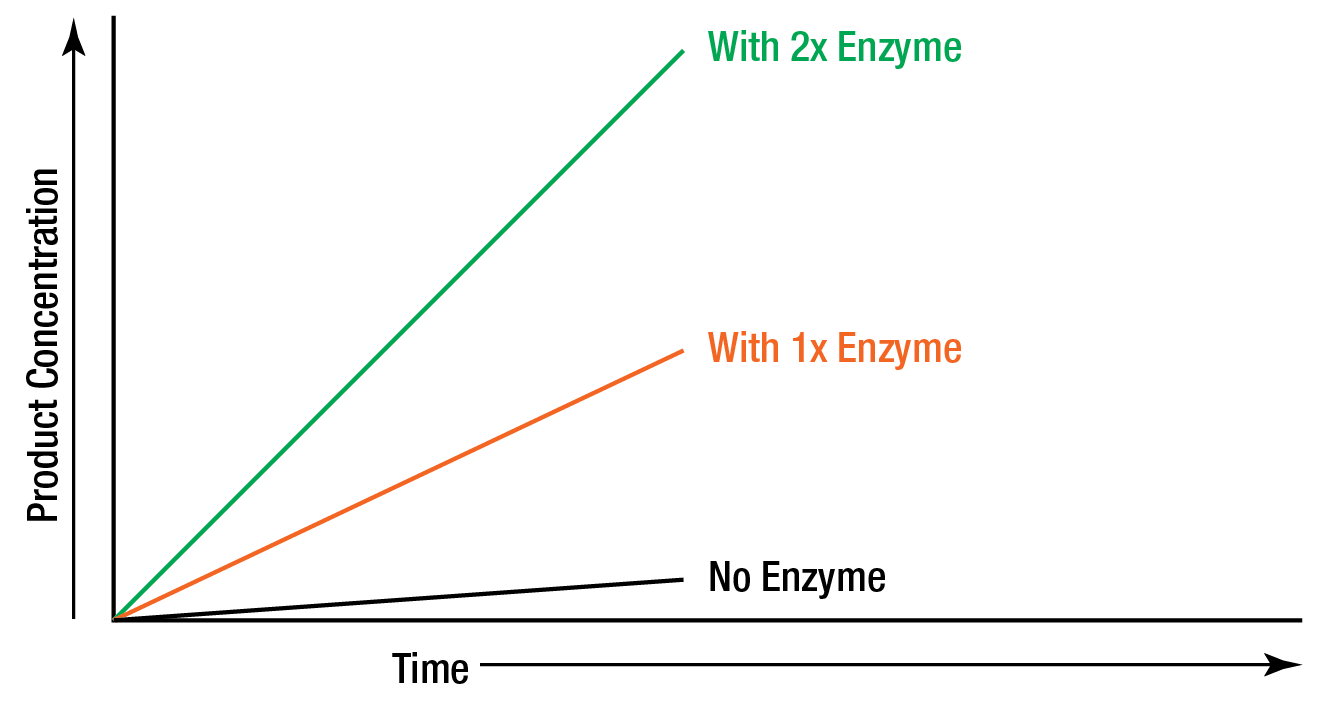
Figure 4: “Zero order” reaction rate is independent of substrate concentration.
These reactions are said to be "zero order" because the rates are independent of substrate concentration, and are equal to some constant k. The formation of product proceeds at a rate which is linear with time. The addition of more substrate does not serve to increase the rate. In zero order kinetics, allowing the assay to run for double time results in double the amount of product.
| Order | Rate Equation | Comments |
|---|---|---|
| zero | rate = k | rate is independent of substrate concentration |
| first | rate = k[S] | rate is proportional to the first power of substrate concentration |
| second | rate = k[S][S]=k[S]2 | rate is proportional to the square of the substrate concentration |
| second | rate = k[S1][S2] | rate is proportional to the first power of each of two reactants |
The amount of enzyme present in a reaction is measured by the activity it catalyzes. The relationship between activity and concentration is affected by many factors such as temperature, pH, etc. An enzyme assay must be designed so that the observed activity is proportional to the amount of enzyme present in order that the enzyme concentration is the only limiting factor. It is satisfied only when the reaction is zero order.
In Figure 5, activity is directly proportional to concentration in the area AB, but not in BC. Enzyme activity is generally greatest when substrate concentration is unlimiting.
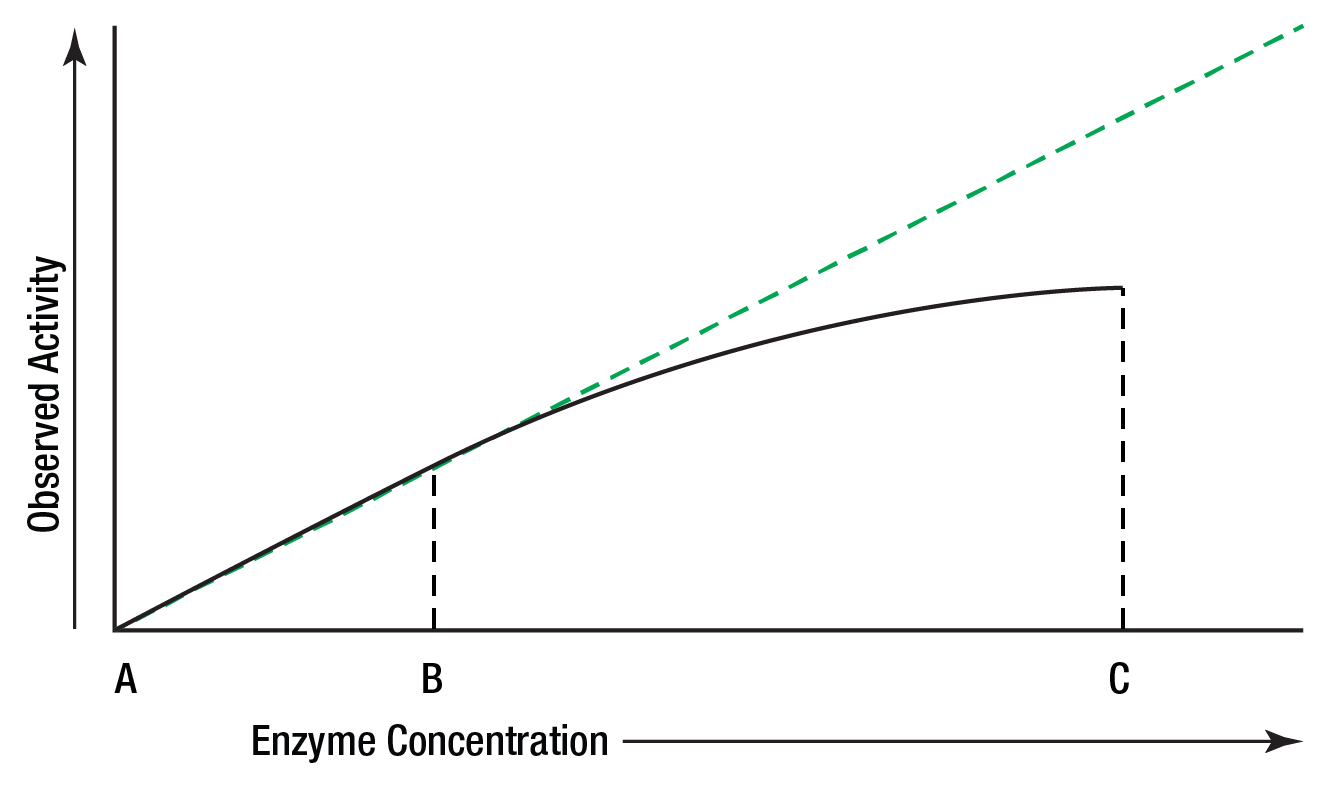
Figure 5: Activity vs. concentration.
When the concentration of the product of an enzymatic reaction is plotted against time, a similar curve results, Figure 6.
Between A and B, the curve represents a zero order reaction; that is, one in which the rate is constant with time. As substrate is used up, the enzyme's active sites are no longer saturated, substrate concentration becomes rate limiting, and the reaction becomes first order between B and C.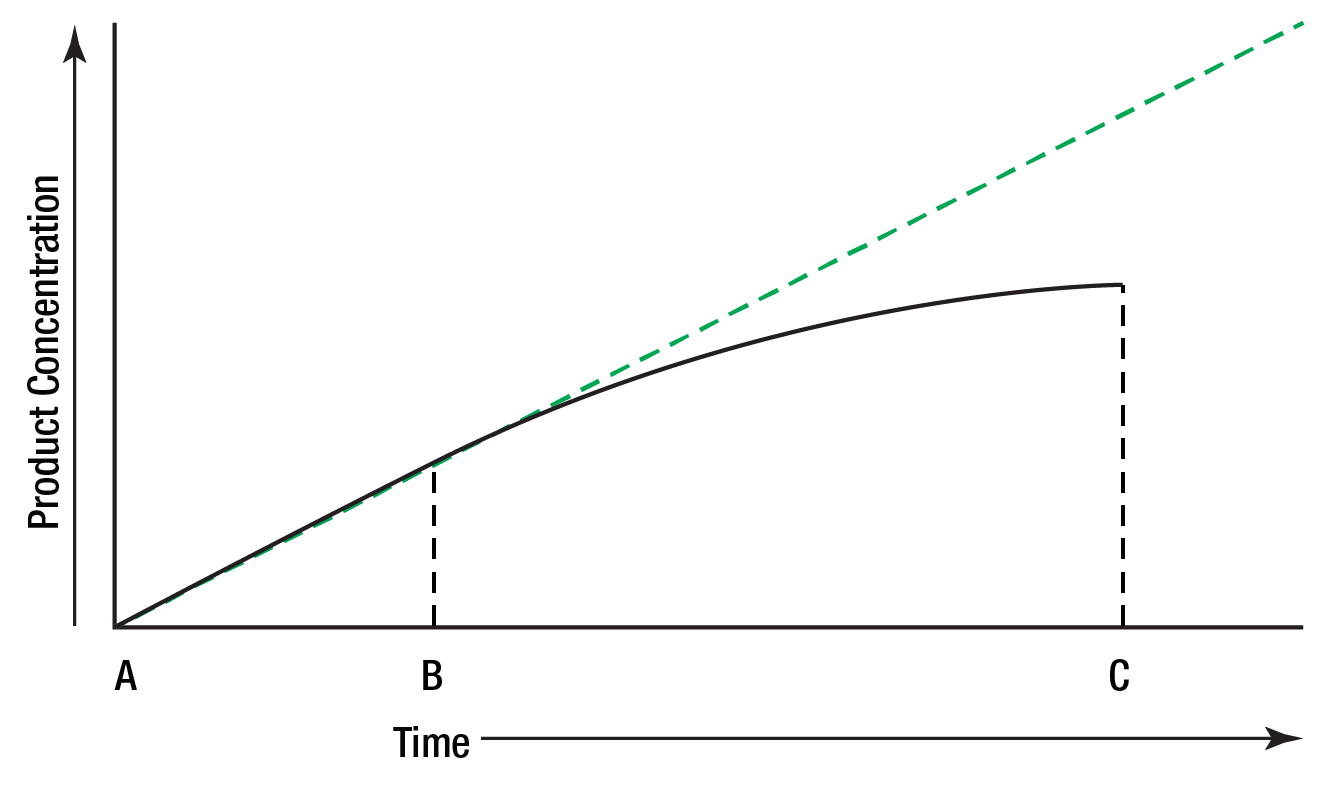
Figure 6: Reaction rate limited by substrate concentration.
To measure enzyme activity ideally, the measurements must be made in that portion of the curve where the reaction is zero order. A reaction is most likely to be zero order initially since substrate concentration is then highest. To be certain that a reaction is zero order, multiple measurements of product (or substrate) concentration must be made.
Figure 7 illustrates three types of reactions which might be encountered in enzyme assays and shows the problems which might be enountered if only single measurements are made.
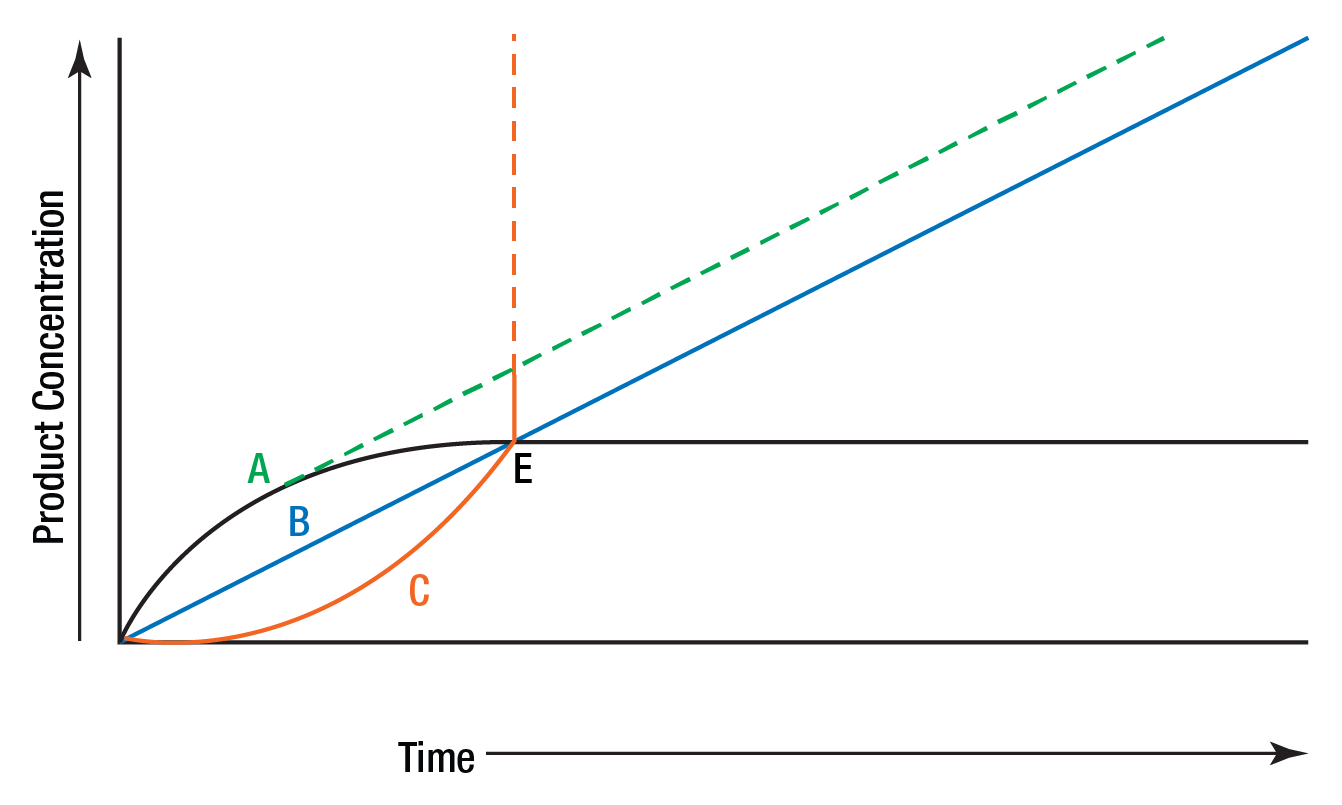
Figure 7: Leading, lagging, and linear reaction.
B is a straight line representing a zero order reaction which permits accurate determination of enzyme activity for part or all of the reaction time. A represents the type of reaction that was shown in Figure 6. This reaction is zero order initially and then slows, presumably due to substrate exhaustion or product inhibition. This type of reaction is sometimes referred to as a "leading" reaction. True "potential" activity is represented by the dotted line. Curve C represents a reaction with an initial "lag" phase. Again the dotted line represents the potentially measurable activity. Multiple determinations of product concentration enable each curve to be plotted and true activity determined. A single end point determination at E would lead to the false conclusion that all three samples had identical enzyme concentration.
File
Introduction to Enzymes
(272.27 KB)